Generating Patterns and Graphing Relationships
Consider the table given below.
| x | y |
| 1 | 3 |
| 2 | 4 |
| 3 | 5 |
| 4 | 6 |
Let's find the relationship between x and y.
Observe that:
Row 1: 1 + 2 = 3
Row 2: 2 + 2 = 4
Row 3: 3 + 2 = 5
Row 4: 4 + 2 = 6
So, x + 2 = y.
The rule or the function is y = x + 2.
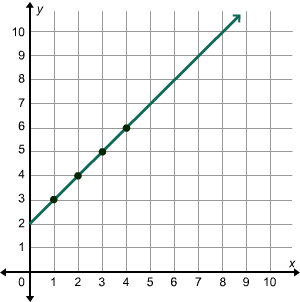
Now, let's find the ordered pairs and draw the graph.
Each row in the table represents an ordered pair.
An ordered pair (x, y) tells the location of a point on the coordinate plane.
The x-coordinate (x-value) tells the distance of the point from the origin in the horizontal direction. The y-coordinate (y-value) tells the distance of the point from the origin in the vertical direction.
The ordered pairs for the given x- and y-values are (1, 3), (2, 4), (3, 5), and (4, 6).
Now, plot a point for each ordered pair.
First plot the point (1, 3). Start at (0, 0) and move 1 unit right and 3 units up.
Similarly, plot the other points.
Then, draw a line passing through these points. The line represents all ordered pairs that follow the rule.

A B C D E F G H I J K L M N O P Q R S T U V W X Y Z
Help
The correct answer is
Remember :
The smallest number is the one that comes first while counting.
Solution :
To arrange the given numbers in order from smallest to greatest, find the smallest number among all the given numbers.
21,27,23
21 is the smallest number.

